Need to add some attractive infographics to your next project? An infographic is a great way to engage readers with stimulating visuals. We’ve collected ten awesome infographic templates here, free to use in your next website or blog post. These will definitely draw the eye!

When you get a bright idea, break it down with this light bulb infographic. When you need to split something into easily readable segments, this is just the thing. Just make sure to credit the author. You might see something like this on an about page!

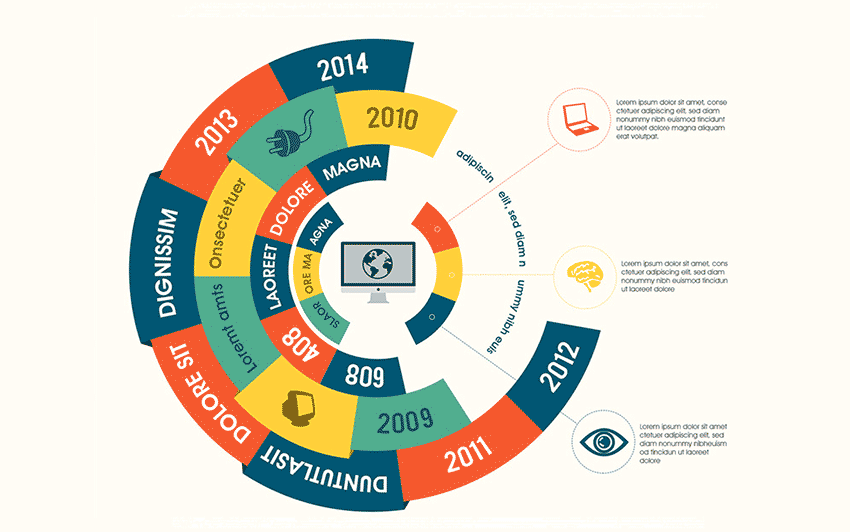
This tech infographic set is packed with technology-based diagrams and objects. There are various device screens with graphs inside them, a complex and colorful circular diagram, and a bunch of other graphs too! Just download the PSD, pick one of the three colors, and get to customizing. All graphics are vectors for easy editing.


Available in multiple color palettes, this brochure bundle is a great starting point if you want to make your own infographic. Everything is here: charts, graphs, comparisons, maps, and timelines, all structured into a multi-page brochure. You can download it in AI and EPS format if you give them your email, so make sure to snap this one up.

This dazzling dark timeline looks simply amazing. If you want to turn a company’s journey or their future plans into a visual, this is the template to use. There’s room for a lot of customization here. Edit the icons, add little blurbs, or change the colors as you need!


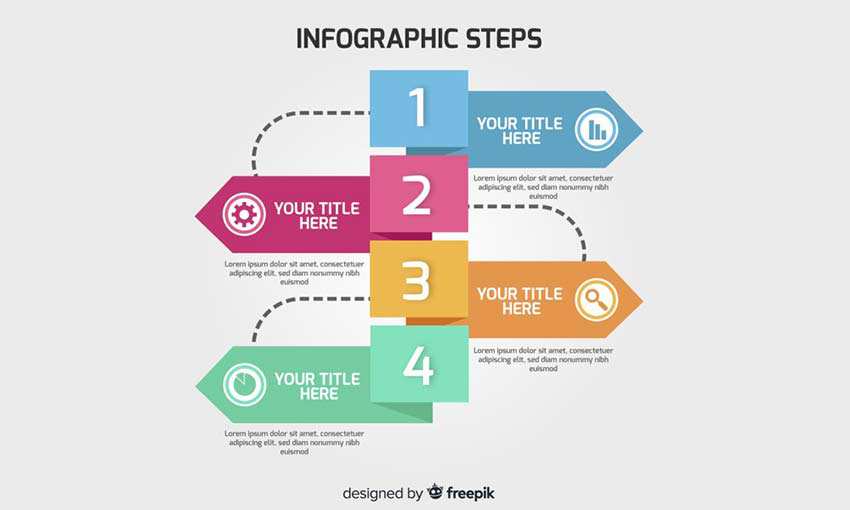
Breaking things down into easy steps is an effective way to communicate a lot of information. Guide people with this colorful step-by-step vector graphic and eliminate confusion from a difficult process.

If you’re trying to craft your own infographic, these vector sets are exactly what you’re looking for. From 85 different pie charts to every graph under the sun, you will find the information graphic you’re looking for somewhere in here. While these aren’t ready-to-go templates, you’ll definitely find elements you’ll want to include in an infographic.

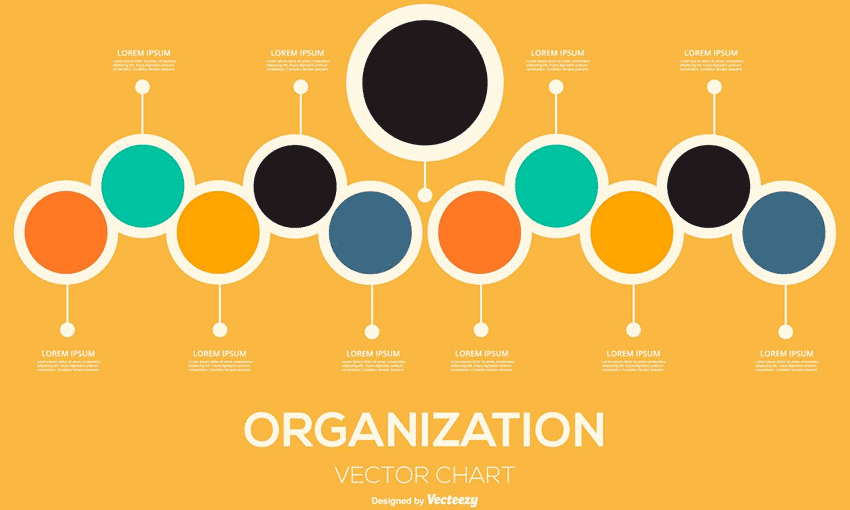
Organize your ideas with this wonderfully lively chart. These colorful circles can make a lot of steps and information fun and interesting. Fill the circles with vector icons, or even use it to show off a company’s employees! There’s a lot of potential with this chart.

If you need to incorporate a map in your design, try this infographic. There’s a vector map, a globe, a set of each continent with a blurb, and even a little bar chart just in case! Edit the infographic as-is or use one of its elements to create something new.

Tell a Story with Visuals
An infographic can be just what you need to spruce up a page. The bright colors and eye-catching visuals never fail to liven up a webpage or blog. With these templates, creating a beautiful infographic is no longer a chore. You can whip up exciting visuals in minutes!